
So you’re planning a demo? Or you have an idea but need data to test it before you apply it to a customer utilising your monitoring solution?
Well have no fear! Here I am to trial and break a number of different solutions to do just that!
Let me be your guide

First of all, for my tiny reader base of just me. I am sorry for the hiatus! I started this whole thing, and then we found out we were expecting our second child which changed a number of my priorities. I am now the proud Dad of 2! Which by the way is actually giving me less time to do stuff like this, but hey ho. Let’s see how far I get.
In this short series of posts I will be looking at trace generators.
I have an idea for a post I want to make, however to do so I need traces. Rather than writing my own little mini app, I decided it was in the best interest of time to not reinvent the wheel here. After checking my Linked In saved posts I found I had saved posts for 3 different trace generators I had wanted to try and test.
What is a trace generator?
A trace generator is a simple application which can generate trace data for you. What you do with this trace data is up to you. In my case I am going to be sending the data to SumoLogic to present in a lovely dashboard.
The trace generator and setup
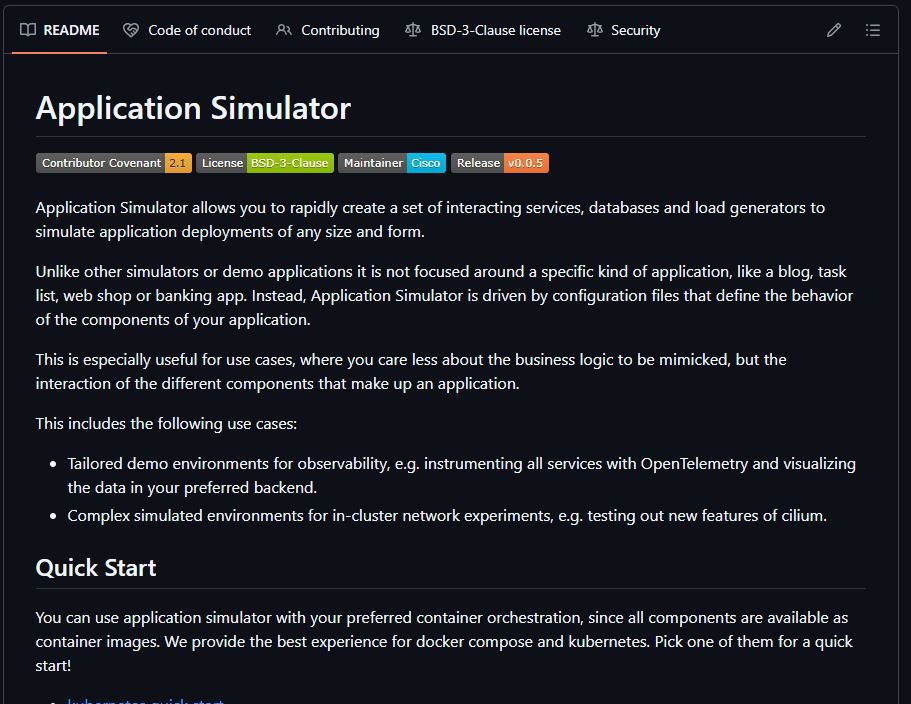
The first generator/simulator on the chopping block is AppSimulator which is available on Cisco-Open github: https://github.com/cisco-open/app-simulator
This sim is fairly straight forward to set-up, although I did hit some trivial issues created by me during the setup.
The initial setup was:
- Re-install docker (the approach I took) on to my windows machine.. yes I said windows
- Deploy via docker-compose – there nice and easy right?
My first backwards step was the generator container provided. It didn’t like the variables given, and decided that they were not numbers. I disagree with my machine because they were the defaults provided, but what do I know?
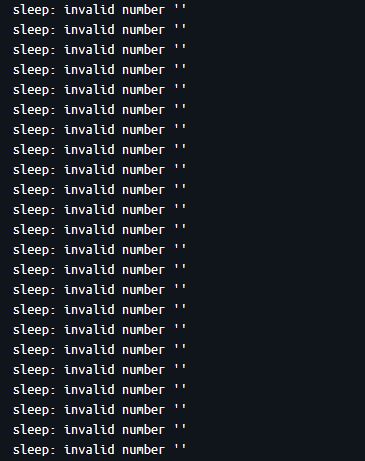
This isn’t a big deal, as all this container is doing is calling the endpoints that are defined in my initial yaml file. I can create my own generator later.
Initial configuration
services:
  frontend:
    type: java
    exposedPort: 3000
    endpoints:
      http:
        /upload:
          - http://processing/magicByte
          - http://processing/virus
  processing:
    type: java
    endpoints:
      http:
        /magicByte:
          - cache,128
        /virus:
          - http://virus-scanner/scan
  virus-scanner:
    type: nodejs
    endpoints:
      http:
        scan:
          - sleep,1500
          - call: error,500,Scan failed
            probability: 0.1
          - sleep,500
loaders:
  user-1:
    type: curl
    wait: 0
    sleep: 500
    urls:
      - http://frontend/upload
      - http://frontend/upload
      - http://frontend/upload
The configuration items are fairly straight forward. Define your services, what endpoints they have. Then what those endpoints do (Call other services, wait, error etc)
The part which failed for me was the loader. User-1. No matter what I did it refused to accept any of the variables. This is the default example given by the github tutorial. So I could only assume on most systems it does. I put this down to my machine being windows.
Turning this into the required docker-compose file is easily achieved via:
docker run --rm -t -i -v :/mnt ghcr.io/cisco-open/app-simulator-generators-docker-compose --config /mnt/config.yaml --output /mnt/docker-compose.yamlThe next step is to simply call
docker compose up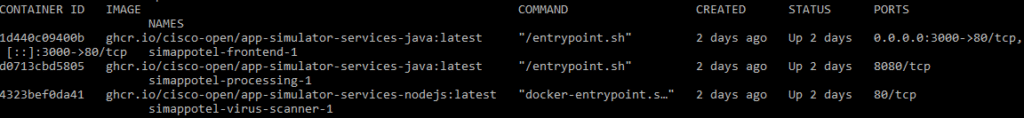
Beautiful – wait where are my traces? – let’s add some telemetry data, and send it somewhere
To do this we need to download the relevant OTEL auto instrumentation agents. In this example those are node.js and java
curl -L -O https://github.com/open-telemetry/opentelemetry-java-instrumentation/releases/latest/download/opentelemetry-javaagent.jar
echo {} > package.json
npm install @opentelemetry/auto-instrumentations-node
Then we create a docker-compose override file – docker-compose.override.yaml
services:
  frontend:
    environment:
      - JAVA_TOOL_OPTIONS=-javaagent:/mnt/opentelemetry-javaagent.jar
      - OTEL_RESOURCE_ATTRIBUTES=service.name=frontend
      - OTEL_EXPORTER=otlp
      - OTEL_EXPORTER_OTLP_ENDPOINT=<yourOTLPEnpointGoesHere>
    volumes:
      - ./opentelemetry-javaagent.jar:/mnt/opentelemetry-javaagent.jar
  processing:
    environment:
      - JAVA_TOOL_OPTIONS=-javaagent:/mnt/opentelemetry-javaagent.jar
      - OTEL_RESOURCE_ATTRIBUTES=service.name=processing
      - OTEL_EXPORTER=otlp
      - OTEL_EXPORTER_OTLP_ENDPOINT=<yourOTLPEnpointGoesHere>
    volumes:
      - ./opentelemetry-javaagent.jar:/mnt/opentelemetry-javaagent.jar
  virus-scanner:
    environment:
      - NODE_PATH=/mnt/node_modules
      - NODE_OPTIONS=-r "@opentelemetry/auto-instrumentations-node/register"
      - OTEL_RESOURCE_ATTRIBUTES=service.name=virus-scanner
      - OTEL_EXPORTER=otlp
      - OTEL_EXPORTER_OTLP_ENDPOINT=<yourOTLPEnpointGoesHere>
    volumes:
      - ./node_modules:/mnt/node_modules
running docker compose up will combine the two files and you should see telemtry data flowing into your endpoint.
At this point, all my pods but one failed. My loader was up and running, but still like my new born failing to sleep.

So, the reason I had at least 1 hour between now and when I started my instrumentation attempt was due to a problem between the seat and the keyboard. The human interface is buggy as hell. Just a note, make sure to download the agents to the same location you are running your docker commands from. I didn’t.
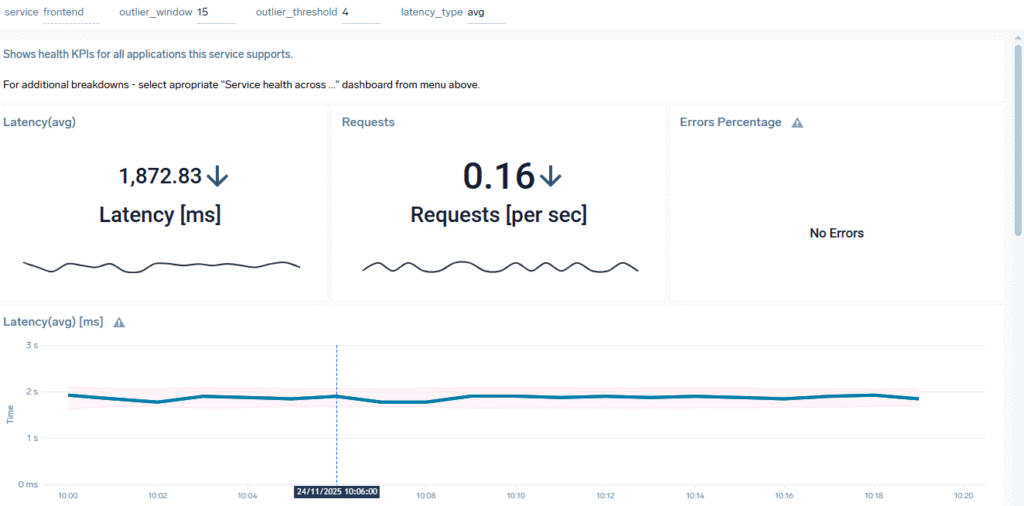
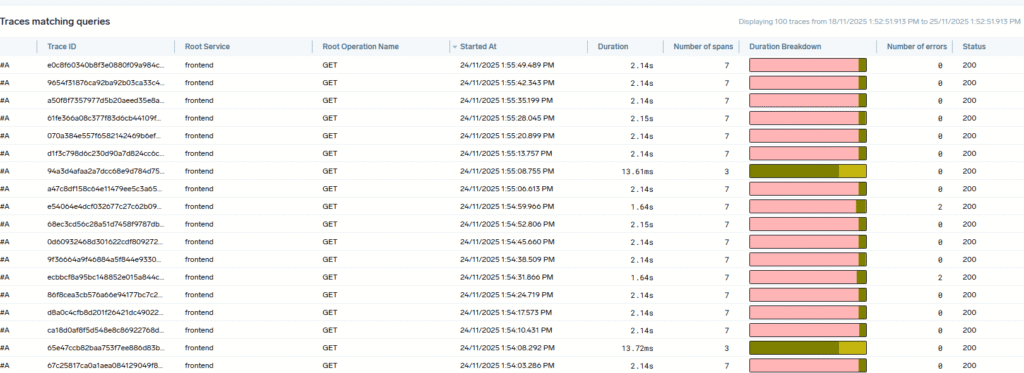
The Trace data:
In my sumologic instance I can now see my services, and my raw trace data! Success!
Appendix
Following this, I did make some changes to the initial configuration. I added a new endpoint for Frontend and Processing called HealthcheckV2. Which when added worked succesfully.
There are also some configuration factors to note with this generator/simulator. You have some control over the randomness in that you can introduce errors. You can see this in the default example configuration. If you take a look at the original config.yaml file you can see that the scan endpoint has a 1 in 10 chance of error.
  virus-scanner:
    type: nodejs
    endpoints:
      http:
        scan:
          - sleep,1500
          - call: error,500,Scan failed
            probability: 0.1
          - sleep,500
This same snippet also shows that you can add sleeps to your calls to increase and vary the latency. You can simulate a slow call, or even just chuck in a slow call every now and then. This could be especially useful if you are testing a trace sampler.
I did also write a short python script to call my endpoints to replace the loader I didn’t want to spend any time fixing
#Created by notanexpertbut 22/11/2025
#Call Generator for Sample OTEL App
# v1
import requests
from datetime import timedelta
from datetime import datetime

RunTime = timedelta(minutes=60)
now = datetime.now()
RunTimeComplete = now + RunTime
currentMinute = now
currentTimer = now

print(now)

Minutes = timedelta(minutes=30)

print("start")
while datetime.now() < RunTimeComplete:
    # every minute call healtcheckv1 delta of 1 min

    if currentMinute <= datetime.now():
        r = requests.get('http://localhost:3000/healthcheckV1')
        currentMinute = datetime.now() + timedelta(minutes=1)
    # TODO make upload calls more random hit upload
    if currentTimer <= datetime.now():
        r = requests.get('http://localhost:3000/upload')
        currentTimer = datetime.now() + timedelta(seconds=5)

print("End")